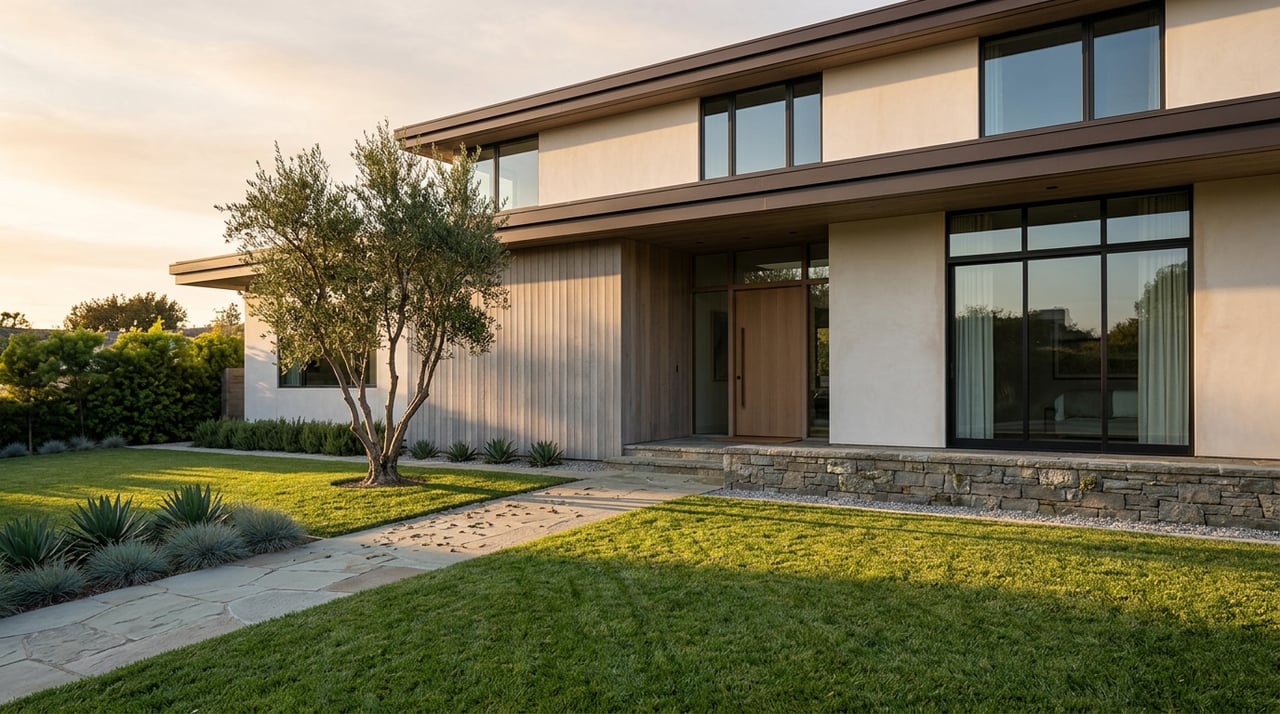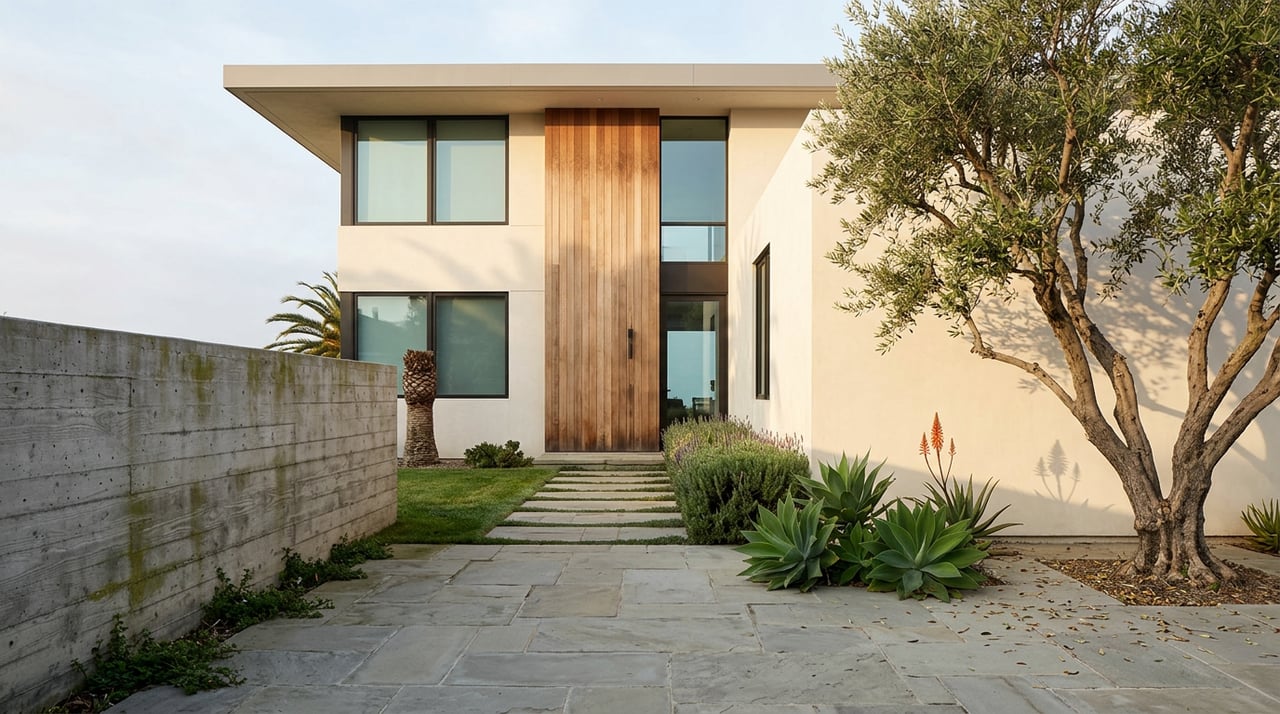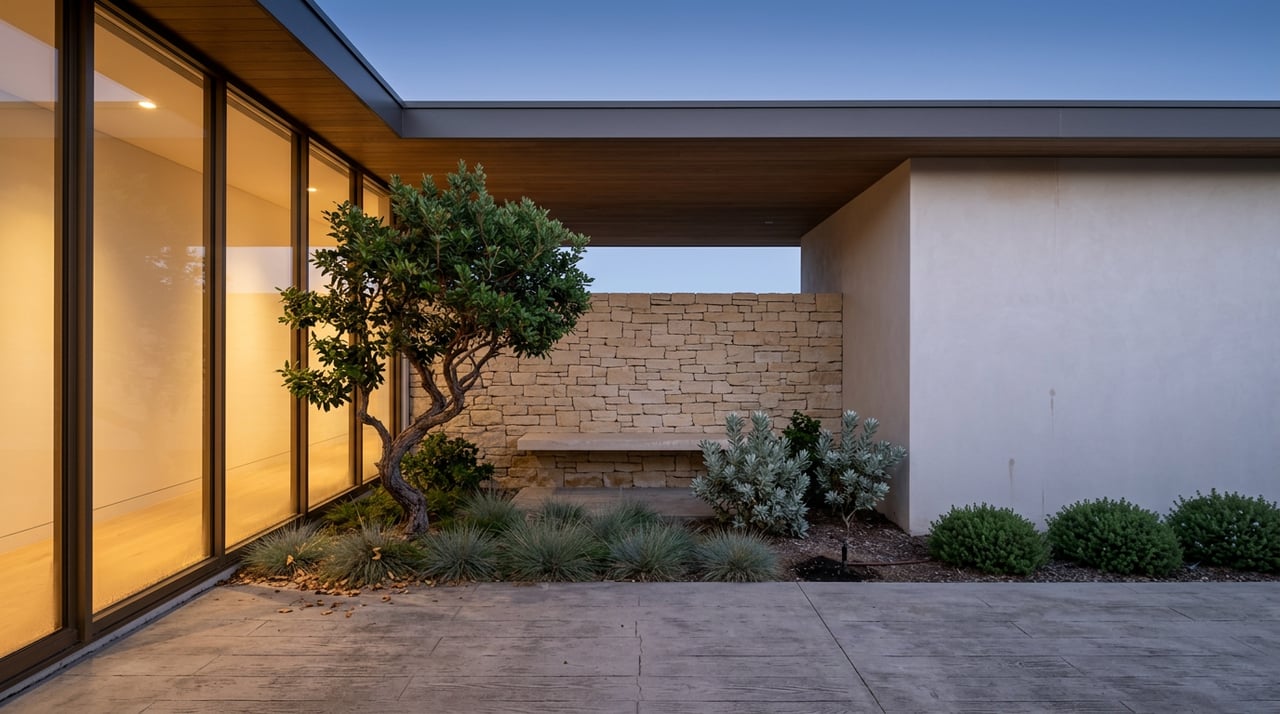
Ask two different sources how the Palos Verdes Estates market is doing right now and you'll get two different cities. One says homes are sitting for months, buyers have the leverage, and sellers are cutting prices to compete. The other says homes are closing above asking, median prices are climbing, and the market has never priced better. Both are describing September 2026. Neither is wrong. That's the part worth understanding before you list or write an offer here.
Two Reports, Same City, Different Story
National portal data paints a market that's cooling. As of February 2026, one widely cited housing tracker put Palos Verdes Estates at a 7.4-month supply of inventory, up from 4.3 months a year earlier, with homes sitting a median of 99 days and only 5 houses selling that month. The sale-to-list ratio had slipped to 97.69 percent, and the share of homes selling over asking price had fallen from 20 percent to zero. Redfin's numbers over the three months ending May 2026 told a similar story: median sale price down slightly year over year, and homes taking a median of 43 days to sell compared to 32 days the year before. Read only these figures and you'd tell a seller to brace for a slow, discount-heavy fall.
But look at what actually closed in July 2026 and the picture flips. Closed-sale records for that month show 17 homes sold in Palos Verdes Estates, fewer than the 24 that sold in July 2025, but at a median price of $2.73 million, up from $2.44 million the year before. The average sold price rose to roughly $3.13 million from $3.06 million. And homes that did sell closed at 100.7 percent of list price, compared with 96.5 percent a year earlier. That's not a buyer's market. That's a market where the homes that transact are getting bid up.
Both data sets are accurate. They're just measuring different things.
What "Average Days on Market" Is Actually Hiding
Here's the mechanism most portal summaries never explain: a citywide average blends every listing into one number, and in a small, low-turnover city like Palos Verdes Estates, a handful of stale listings can move that average a long way.
Picture the current inventory as two separate pools. In one pool are homes priced accurately, presented well, and positioned for the buyers actually shopping this fall. Those homes are the ones closing in weeks, at or above asking, and they're the reason the July 2026 sold price and sold-to-list ratio look strong. In the other pool are homes that got priced to last year's comps, or listed without the staging and photography that this price bracket now expects. Those homes don't sell. They sit. And every month they sit, they add days to the citywide "average days on market" figure, dragging the aggregate number down even while the well-positioned homes around them are moving fast.
That's why you can have rising months of supply and a falling median days-on-market ratio in the same city at the same time. It isn't a contradiction in the data. It's a description of a market that has split into two very different experiences depending on how a home is priced and presented, and the citywide average can't tell you which experience you're going to have.
Where the Real Action Is: Four Neighborhoods, Four Different Markets
Palos Verdes Estates is usually described in terms of five residential pockets: Malaga Cove, Lunada Bay, Monte Malaga, Valmonte, and Margate. Treating the city as one market erases what's actually happening street by street.
Valmonte is the clearest example of the composition story. In the first half of 2026, only 14 single-family homes sold there, down sharply from 23 in the same period of 2025. You'd expect that drop in volume to come with a drop in price. Instead, price per square foot rose 4.7 percent, from $1,102 to $1,154, and the average sale price climbed from $2.62 million to just over $3.04 million. Fewer transactions, higher prices per square foot. That's a market where sellers who don't need to move are holding firm, and the buyers still shopping are willing to pay for the right house rather than wait for a discount that isn't coming.
Malaga Cove carried the highest price per square foot in the city through 2025, at $1,096, reflecting its plaza-centered, historic character and the premium buyers place on that setting.
Lunada Bay, grouped with neighboring Margate in local reporting, posted the largest number of homes sold in the city during 2025, 61 sales compared to 45 the year before, along with the largest gain in price per square foot, up 2.8 percent to $1,044. That's a neighborhood absorbing more transaction volume without giving up pricing power, a genuinely different pattern from Valmonte's low-volume, high-price story next door.
Monte Malaga moved in the opposite direction on volume, with sales falling from 30 homes in 2024 to 21 in 2025, even as it remains home to some of the city's most expensive listings and highest per-acre lots.
Four neighborhoods inside one city, four different combinations of volume and price. A citywide median tells you almost nothing about which of these you're actually competing in.
The Bigger Shift: From Volume Market to Quality Market
Zoom out to the full year and the same pattern holds at the city level. Across 2025, Palos Verdes Estates saw more homes sell overall, transaction count up 7.2 percent, but the average sale price fell 4.7 percent and average price per square foot dropped 3.1 percent. That was a volume market: more deals getting done, many of them at trimmed prices, as buyers and sellers adjusted to higher rates and a longer backlog of inventory.
The July 2026 data shows the opposite mix: fewer transactions, but stronger pricing on the ones that close. Read together, the two periods describe a market that sorted itself. The sellers who had to move in 2025 accepted the market's price. The sellers still listing in 2026 are largely those who don't have to sell, and they're pricing accordingly, which means the buyers left in the market are the ones willing and able to meet that price for the right home. Volume contracted. Quality of transaction went up.
What This Means If You're Listing This Fall
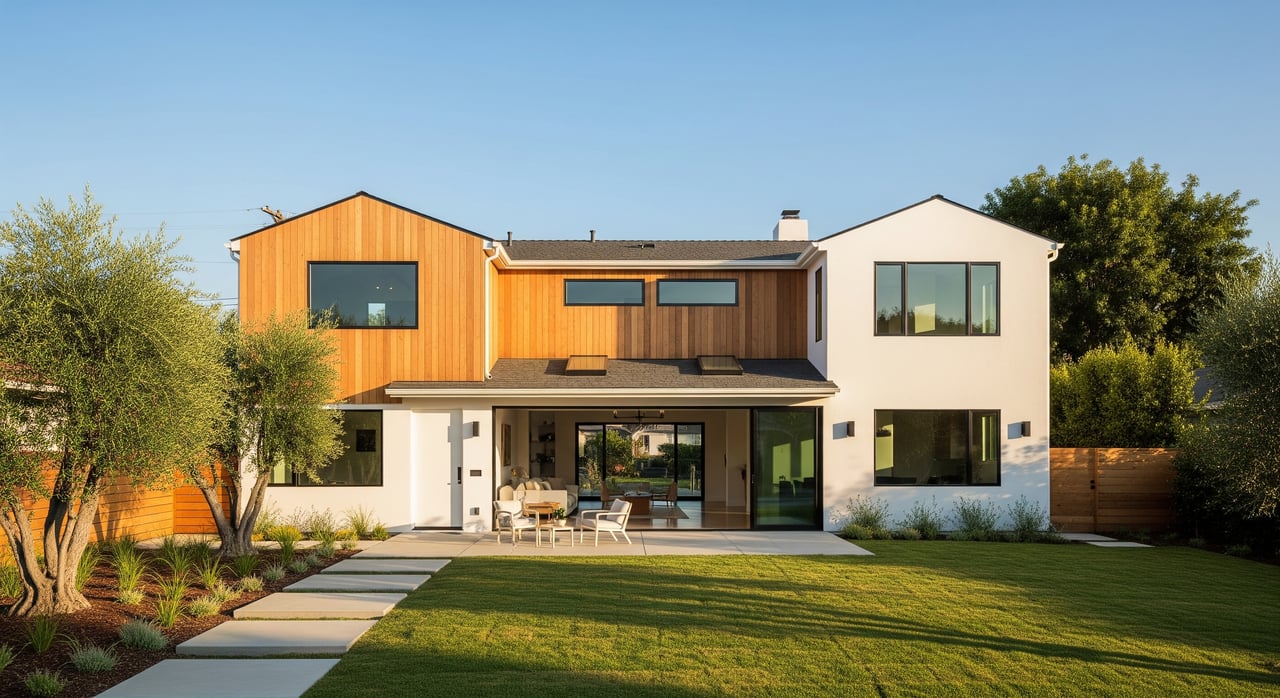
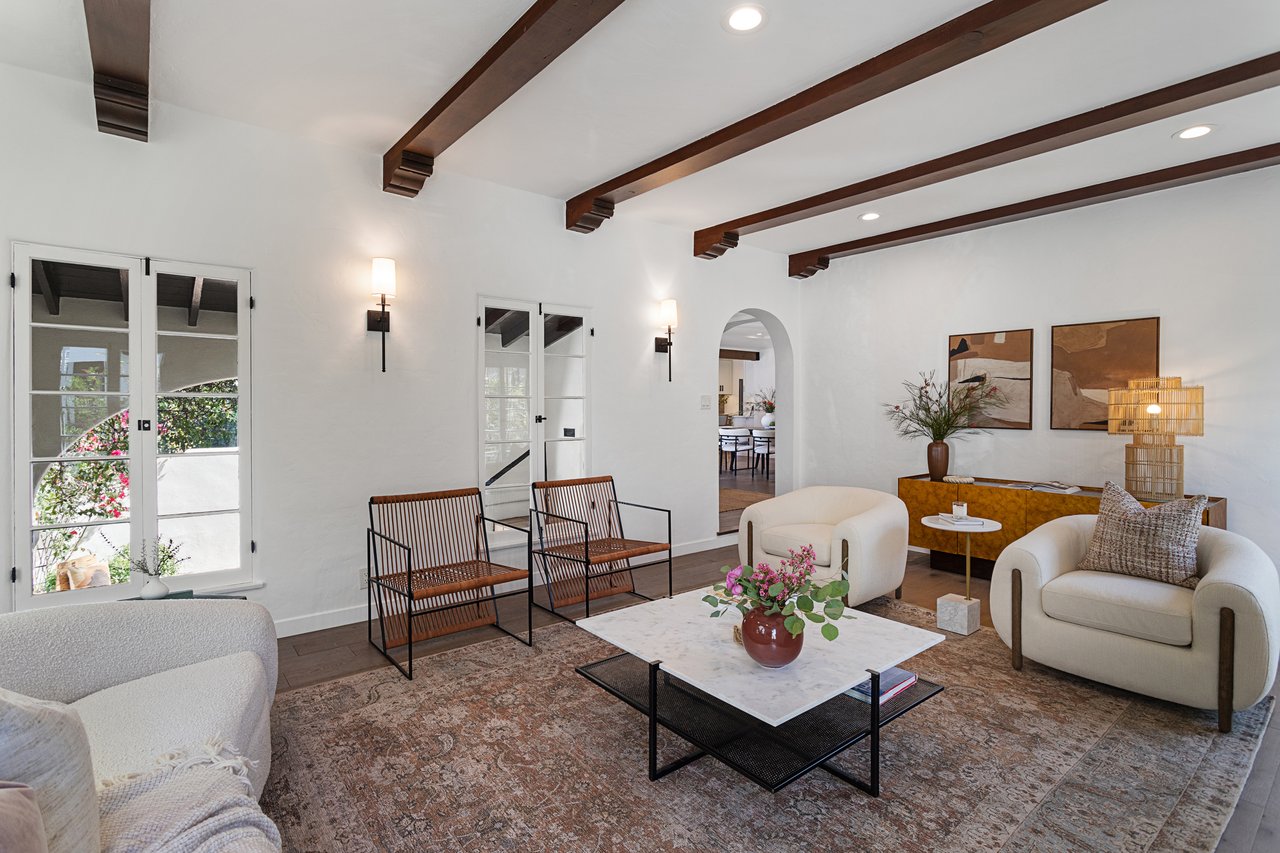
The headline risk in Palos Verdes Estates right now isn't market softness. It's ending up in the wrong pool. A home priced to last year's numbers, without updated photography or a presentation that matches what's actually selling in Malaga Cove or Lunada Bay this year, is the home that becomes part of that 99-day average, the one buyers scroll past because it doesn't look like it belongs in this price bracket anymore.
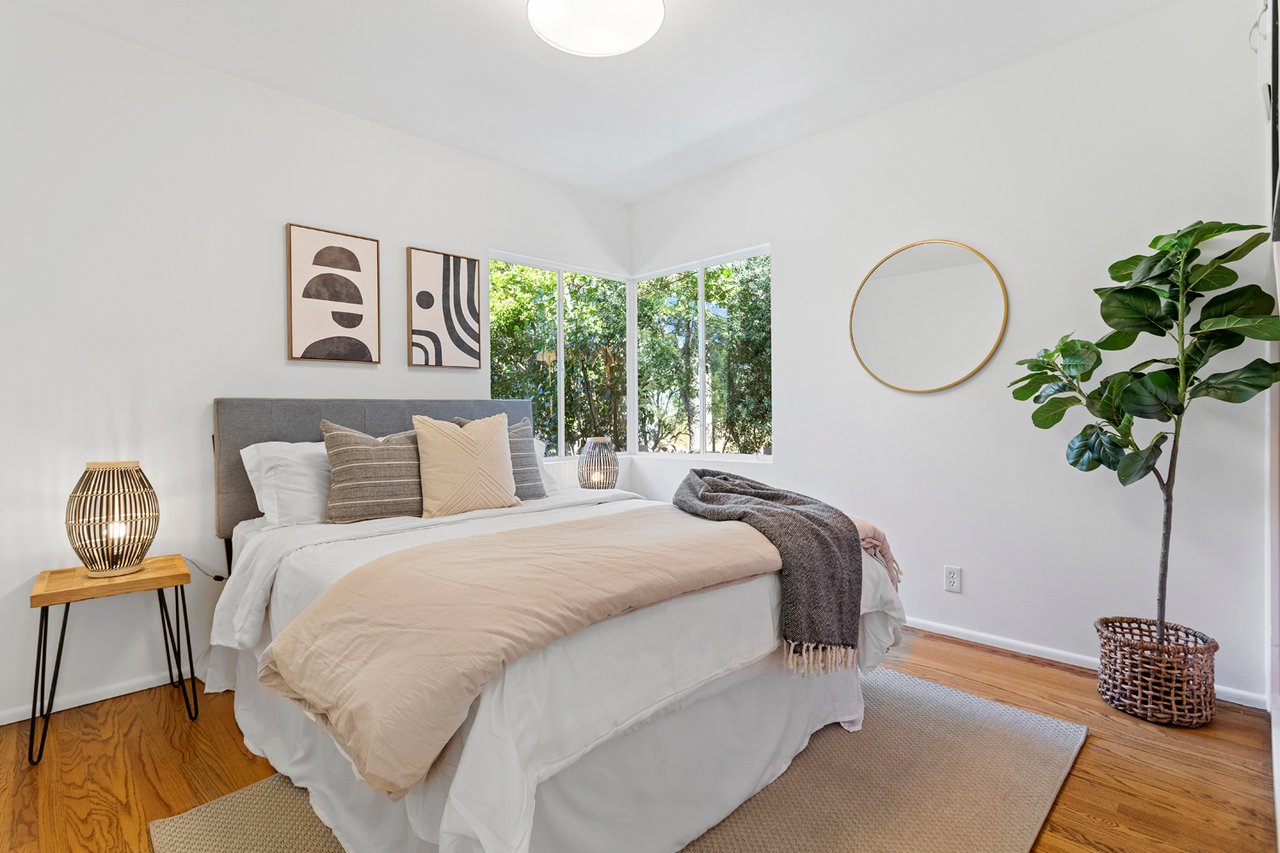
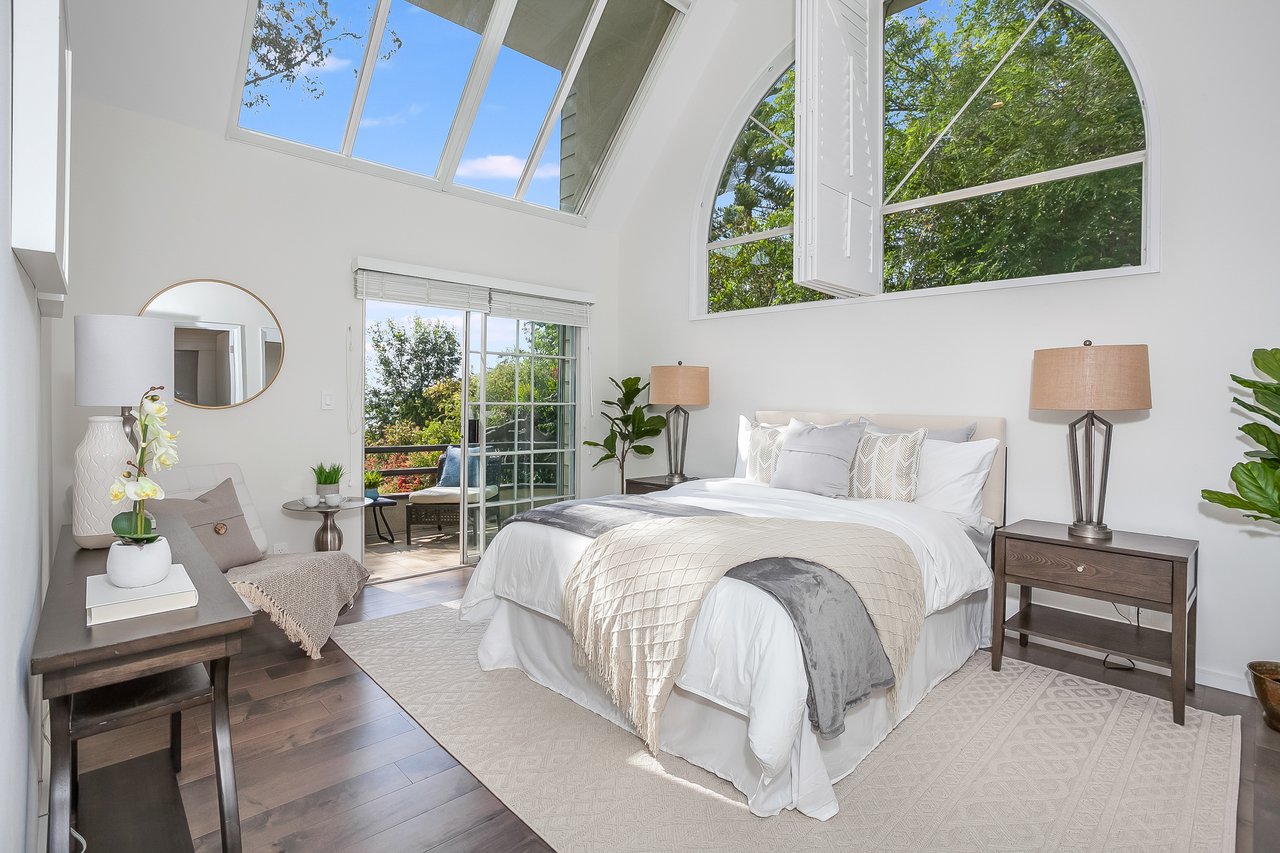
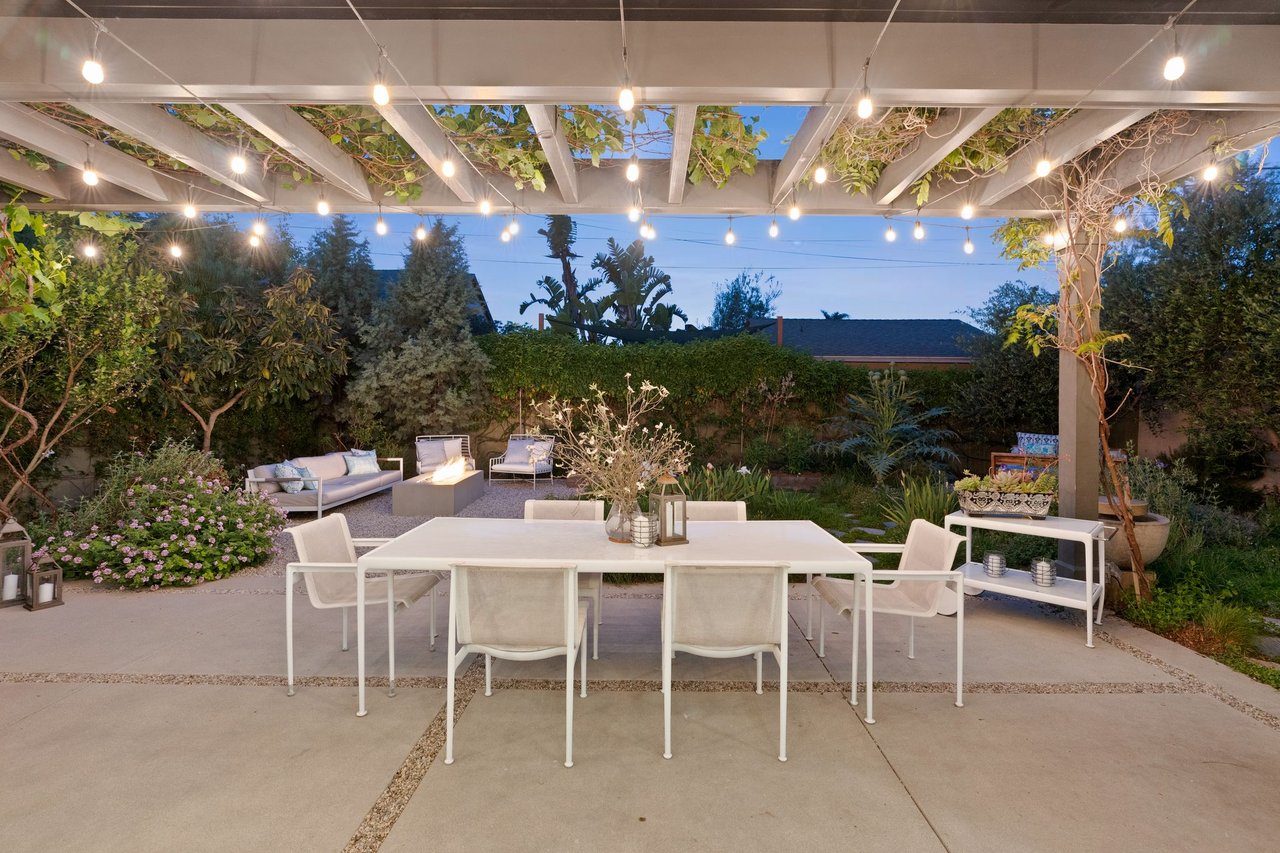
The homes closing at 100.7 percent of list this year aren't getting there by accident. They're priced against the closings in their specific micro-neighborhood, not the citywide median, and they're presented in a way that lets a buyer see the home at its best before they ever schedule a showing. That's the difference between a listing that sits and drags the average down, and one that closes in weeks and pulls it up.
If you want a deeper walk through how to read months of inventory, absorption rate, and price per square foot for your own comparison set, our guide on how to read the Palos Verdes Estates market breaks down the method in more detail.
FAQ
Is Palos Verdes Estates a buyer's market or a seller's market right now? Depends which homes you're looking at. Citywide inventory and days-on-market figures lean toward buyer-friendly conditions, but closed-sale data through mid-2026 shows well-priced homes selling above asking. It behaves like a seller's market for correctly positioned listings and a buyer's market for everything else.
Why do market reports on Palos Verdes Estates disagree so much? Portal-level data averages every active and sold listing citywide, which means a small number of stale, overpriced homes can pull the average days-on-market and sale-to-list figures down even while most transactions are healthy. Neighborhood-level closed-sale data filters that noise out.
Which Palos Verdes Estates neighborhood is performing best right now? It depends on the metric. Lunada Bay and Margate led the city in transaction volume and price-per-square-foot growth through 2025. Valmonte showed the sharpest price-per-square-foot gain in the first half of 2026 despite fewer sales. Malaga Cove has consistently commanded the highest per-square-foot pricing citywide.
If you're weighing whether to list this fall, or trying to figure out where your home actually sits in a market that's telling two different stories at once, Johannes Steinbeck can walk you through the comparable sales that matter for your specific block and pocket of the Peninsula. Request a home valuation to see where your property lines up.